4. Polarimeter vector field#
Import python libraries
from __future__ import annotations

import logging
import math
import os
import shutil
from functools import reduce
from warnings import filterwarnings

import jax
import jax.numpy as jnp
import matplotlib.pyplot as plt
import numpy as np
import svgutils.compose as sc
import sympy as sp
from IPython.display import SVG, display
from matplotlib import cm
from matplotlib.axes import Axes
from matplotlib.collections import LineCollection
from matplotlib.colors import LogNorm
from matplotlib.patches import Patch
from tensorwaves.interface import DataSample
from tqdm.auto import tqdm

from polarimetry import formulate_polarimetry
from polarimetry.data import create_data_transformer, generate_meshgrid_sample
from polarimetry.function import compute_sub_function
from polarimetry.io import (
    mute_jax_warnings,
    perform_cached_doit,
    perform_cached_lambdify,
)
from polarimetry.lhcb import (
    flip_production_coupling_signs,
    load_model_builder,
    load_model_parameters,
)
from polarimetry.lhcb.particle import load_particles
from polarimetry.plot import (
    add_watermark,
    get_contour_line,
    stylize_contour,
    use_mpl_latex_fonts,
)

filterwarnings("ignore")
logging.getLogger("polarimetry.function").setLevel(logging.INFO)
mute_jax_warnings()

NO_TQDM = "EXECUTE_NB" in os.environ
if NO_TQDM:
    logging.getLogger().setLevel(logging.ERROR)
Final state IDs:
\(p\)
\(\pi^+\)
\(K^-\)
Sub-system definitions:
\(K^{**} \to \pi^+ K^-\)
\(\Lambda^{**} \to p K^-\)
\(\Delta^{**} \to p \pi^+\)
Formulate amplitude models
model_choice = 0
model_file = "../data/model-definitions.yaml"
particles = load_particles("../data/particle-definitions.yaml")
amplitude_builder = load_model_builder(model_file, particles, model_choice)
imported_parameter_values = load_model_parameters(
    model_file, amplitude_builder.decay, model_choice, particles
)
models = {}
for reference_subsystem in [1, 2, 3]:
    models[reference_subsystem] = amplitude_builder.formulate(
        reference_subsystem, cleanup_summations=True
    )
    models[reference_subsystem].parameter_defaults.update(imported_parameter_values)
del reference_subsystem

models[2] = flip_production_coupling_signs(models[2], subsystem_names=["K", "L"])
models[3] = flip_production_coupling_signs(models[3], subsystem_names=["K", "D"])

DECAY = models[1].decay
FINAL_STATE = {
    1: "p",
    2: R"\pi^+",
    3: "K^-",
}
Unfold symbolic expressions
unfolded_polarimetry_exprs = {}
unfolded_intensity_expr = {}
for i, model in tqdm(models.items(), "Unfolding expressions", disable=NO_TQDM):
    reference_subsystem = i
    polarimetry_exprs = formulate_polarimetry(amplitude_builder, reference_subsystem)
    unfolded_polarimetry_exprs[i] = [
        perform_cached_doit(expr.doit().xreplace(model.amplitudes))
        for expr in tqdm(polarimetry_exprs, disable=NO_TQDM, leave=False)
    ]
    unfolded_intensity_expr[i] = perform_cached_doit(model.full_expression)
del i, polarimetry_exprs, reference_subsystem
Convert to numerical functions
polarimetry_funcs = {}
intensity_func = {}
for i, model in tqdm(models.items(), "Lambdifying to JAX", disable=NO_TQDM):
    production_couplings = {
        symbol: value
        for symbol, value in model.parameter_defaults.items()
        if isinstance(symbol, sp.Indexed)
        if "production" in str(symbol)
    }
    fixed_parameters = {
        symbol: value
        for symbol, value in model.parameter_defaults.items()
        if symbol not in production_couplings
    }
    polarimetry_funcs[i] = [
        perform_cached_lambdify(
            expr.xreplace(fixed_parameters),
            parameters=production_couplings,
            backend="jax",
        )
        for expr in tqdm(unfolded_polarimetry_exprs[i], disable=NO_TQDM, leave=False)
    ]
    intensity_func[i] = perform_cached_lambdify(
        unfolded_intensity_expr[i].xreplace(fixed_parameters),
        parameters=production_couplings,
        backend="jax",
    )

del fixed_parameters, model, production_couplings
Generate grid phase space sample
data_sample = generate_meshgrid_sample(DECAY, resolution=400)
X = data_sample["sigma1"]
Y = data_sample["sigma2"]
for model in models.values():
    transformer = create_data_transformer(model)
    data_sample.update(transformer(data_sample))
del model, transformer
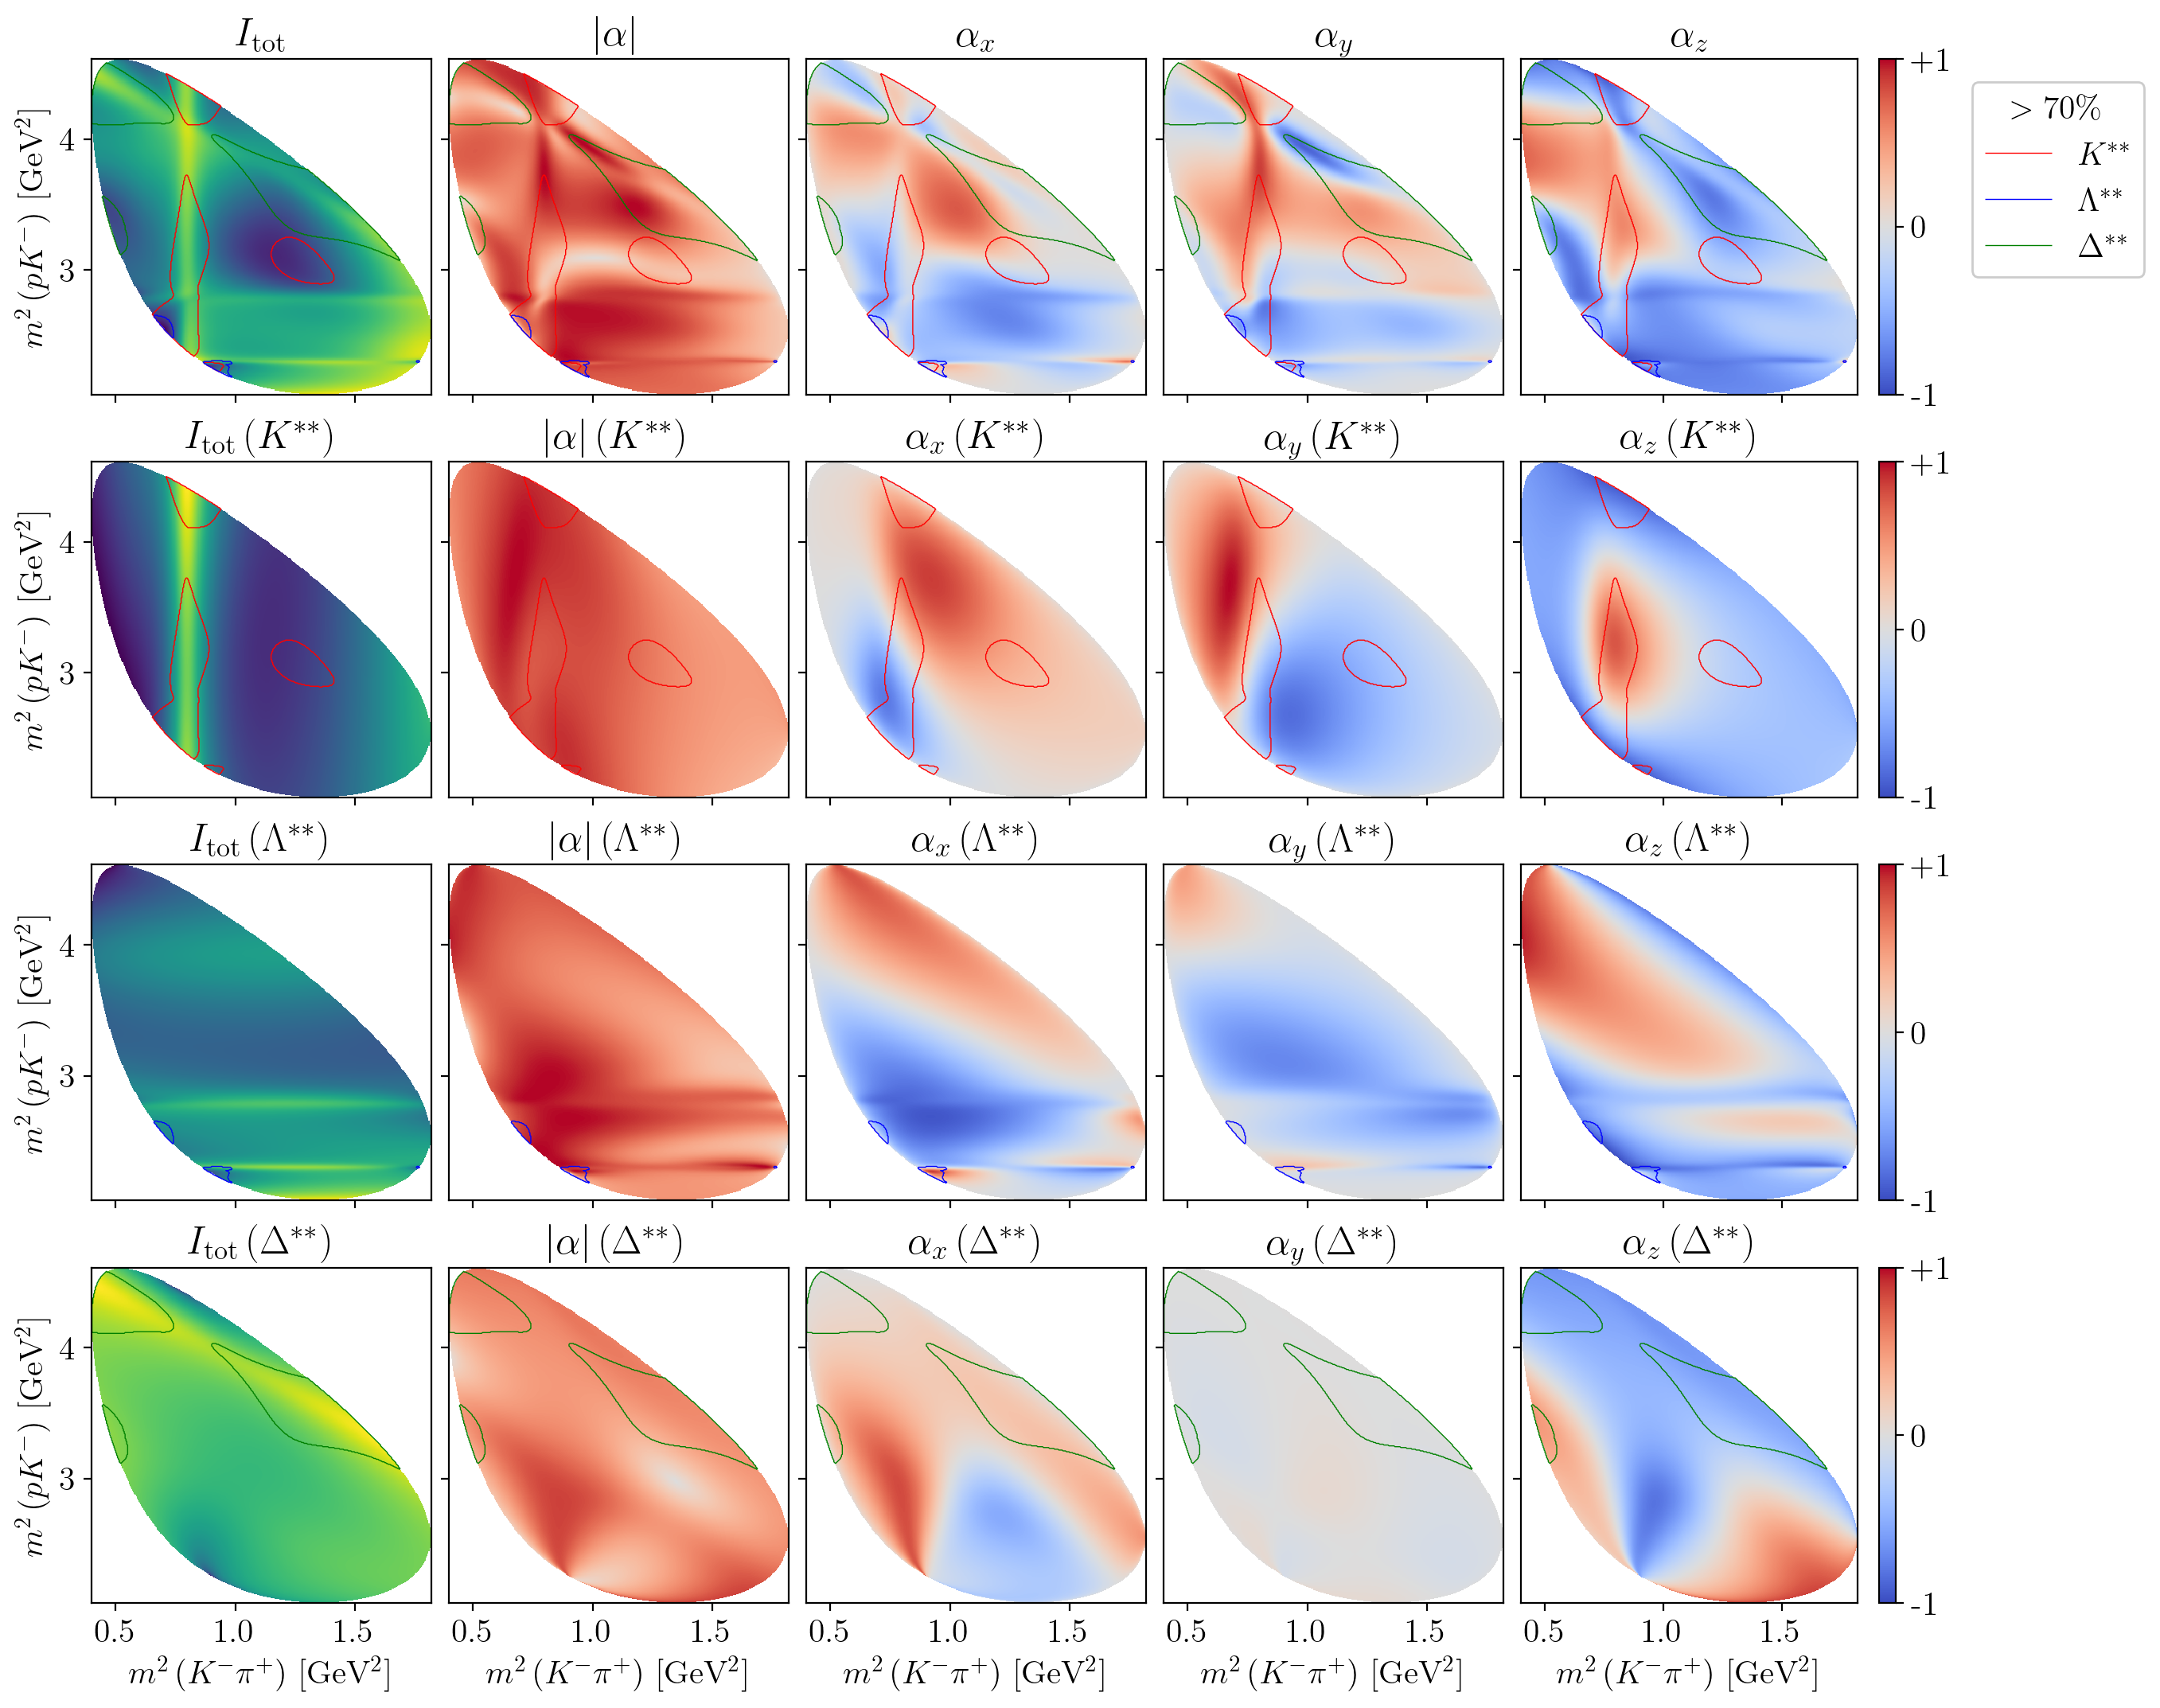
4.1. Dominant contributions#
Code for indicating sub-regions
def create_dominant_region_contours(
    decay, data_sample: DataSample, threshold: float
) -> dict[str, jax.Array]:
    I_tot = intensity_func[1](data_sample)
    resonance_names = [chain.resonance.name for chain in decay.chains]
    region_filters = {}
    progress_bar = tqdm(
        desc="Computing dominant region contours",
        disable=NO_TQDM,
        total=len(resonance_names),
    )
    for resonance_name in resonance_names:
        progress_bar.postfix = resonance_name
        regex_filter = resonance_name.replace("(", r"\(").replace(")", r"\)")
        I_sub = compute_sub_function(intensity_func[1], data_sample, [regex_filter])
        ratio = I_sub / I_tot
        selection = jnp.select(
            [jnp.isnan(ratio), ratio < threshold, True],
            [0, 0, 1],
        )
        progress_bar.update()
        if jnp.all(selection == 0):
            continue
        region_filters[resonance_name] = selection
    contour_arrays = {}
    for contour_level, subsystem in enumerate(["K", "L", "D"], 1):
        contour_array = reduce(
            jnp.bitwise_or,
            (a for k, a in region_filters.items() if k.startswith(subsystem)),
        )
        contour_array *= contour_level
        contour_arrays[subsystem] = contour_array
    return contour_arrays


def indicate_dominant_regions(
    contour_arrays, ax: Axes, selected_subsystems=None
) -> dict[str, LineCollection]:
    if selected_subsystems is None:
        selected_subsystems = {"K", "L", "D"}
    selected_subsystems = set(selected_subsystems)
    colors = dict(K="red", L="blue", D="green")
    labels = dict(K="K^{**}", L=R"\Lambda^{**}", D=R"\Delta^{**}")
    legend_elements = {}
    for subsystem, Z in contour_arrays.items():
        if subsystem not in selected_subsystems:
            continue
        contour_set = ax.contour(X, Y, Z, colors="none")
        stylize_contour(
            contour_set,
            edgecolor=colors[subsystem],
            linewidth=0.5,
            label=f"${labels[subsystem]}$",
        )
        line_collection = get_contour_line(contour_set)
        legend_elements[subsystem] = line_collection
    return legend_elements
Show code cell source
%%time
%config InlineBackend.figure_formats = ['png']
subsystem_identifiers = ["K", "L", "D"]
subsystem_labels = ["K^{**}", R"\Lambda^{**}", R"\Delta^{**}"]
nrows = 4
ncols = 5
scale = 3.0
aspect_ratio = 1.05
plt.rcdefaults()
use_mpl_latex_fonts()
plt.rc("font", size=15)
fig, axes = plt.subplots(
    dpi=200,
    figsize=scale * np.array([ncols, aspect_ratio * nrows]),
    gridspec_kw={"width_ratios": (ncols - 1) * [1] + [1.24]},
    ncols=ncols,
    nrows=nrows,
    sharex=True,
    sharey=True,
)
plt.subplots_adjust(wspace=0.05)

s1_label = R"$m^2\left(K^-\pi^+\right)$ [GeV$^2$]"
s2_label = R"$m^2\left(pK^-\right)$ [GeV$^2$]"
for subsystem in range(nrows):
    for i in range(ncols):
        ax = axes[subsystem, i]
        if i == 0:
            alpha_str = R"I_\mathrm{tot}"
        elif i == 1:
            alpha_str = R"|\alpha|"
        else:
            xyz = i - 2
            alpha_str = Rf"\alpha_{'xyz'[xyz]}"
        title = alpha_str
        if subsystem > 0:
            label = subsystem_labels[subsystem - 1]
            title = Rf"{title}\left({label}\right)"
        ax.set_title(f"${title}$")
        if ax is axes[-1, i]:
            ax.set_xlabel(s1_label)
        if i == 0:
            ax.set_ylabel(s2_label)

intensity_arrays = []
polarimetry_arrays = []
for subsystem in range(nrows):
    # alpha_xyz distributions
    alpha_xyz_arrays = []
    for i in range(2, ncols):
        xyz = i - 2
        if subsystem == 0:
            z_values = polarimetry_funcs[1][xyz](data_sample)
            polarimetry_arrays.append(z_values)
        else:
            identifier = subsystem_identifiers[subsystem - 1]
            z_values = compute_sub_function(
                polarimetry_funcs[1][xyz], data_sample, identifier
            )
        z_values = np.real(z_values)
        alpha_xyz_arrays.append(z_values)
        mesh = axes[subsystem, i].pcolormesh(X, Y, z_values, cmap=cm.coolwarm)
        mesh.set_clim(vmin=-1, vmax=+1)
        if xyz == 2:
            c_bar = fig.colorbar(mesh, ax=axes[subsystem, i])
            c_bar.set_ticks([-1, 0, +1])
            c_bar.set_ticklabels(["-1", "0", "+1"])
    # absolute value of alpha_xyz vector
    alpha_abs = np.sqrt(np.sum(np.array(alpha_xyz_arrays) ** 2, axis=0))
    mesh = axes[subsystem, 1].pcolormesh(X, Y, alpha_abs, cmap=cm.coolwarm)
    mesh.set_clim(vmin=-1, vmax=+1)
    # total intensity
    if subsystem == 0:
        z_values = intensity_func[1](data_sample)
    else:
        identifier = subsystem_identifiers[subsystem - 1]
        z_values = compute_sub_function(intensity_func[1], data_sample, identifier)
    intensity_arrays.append(z_values)
    axes[subsystem, 0].pcolormesh(X, Y, z_values, norm=LogNorm())

threshold = 0.7
contour_arrays = create_dominant_region_contours(DECAY, data_sample, threshold)

for ax in axes[0]:
    legend_elements = indicate_dominant_regions(contour_arrays, ax)
    if ax is axes[0, -1]:
        leg = ax.legend(
            handles=legend_elements.values(),
            title=Rf"$>{100*threshold:.0f}\%$",
            bbox_to_anchor=(0.9, 0.88, 1.0, 0.1),
            framealpha=1,
        )

for subsystem, ax_row in zip(["K", "L", "D"], axes[1:]):
    for ax in ax_row:
        indicate_dominant_regions(
            contour_arrays, ax, selected_subsystems=[subsystem]
        )

plt.show()
CPU times: user 44.7 s, sys: 2.04 s, total: 46.8 s
Wall time: 51.9 s
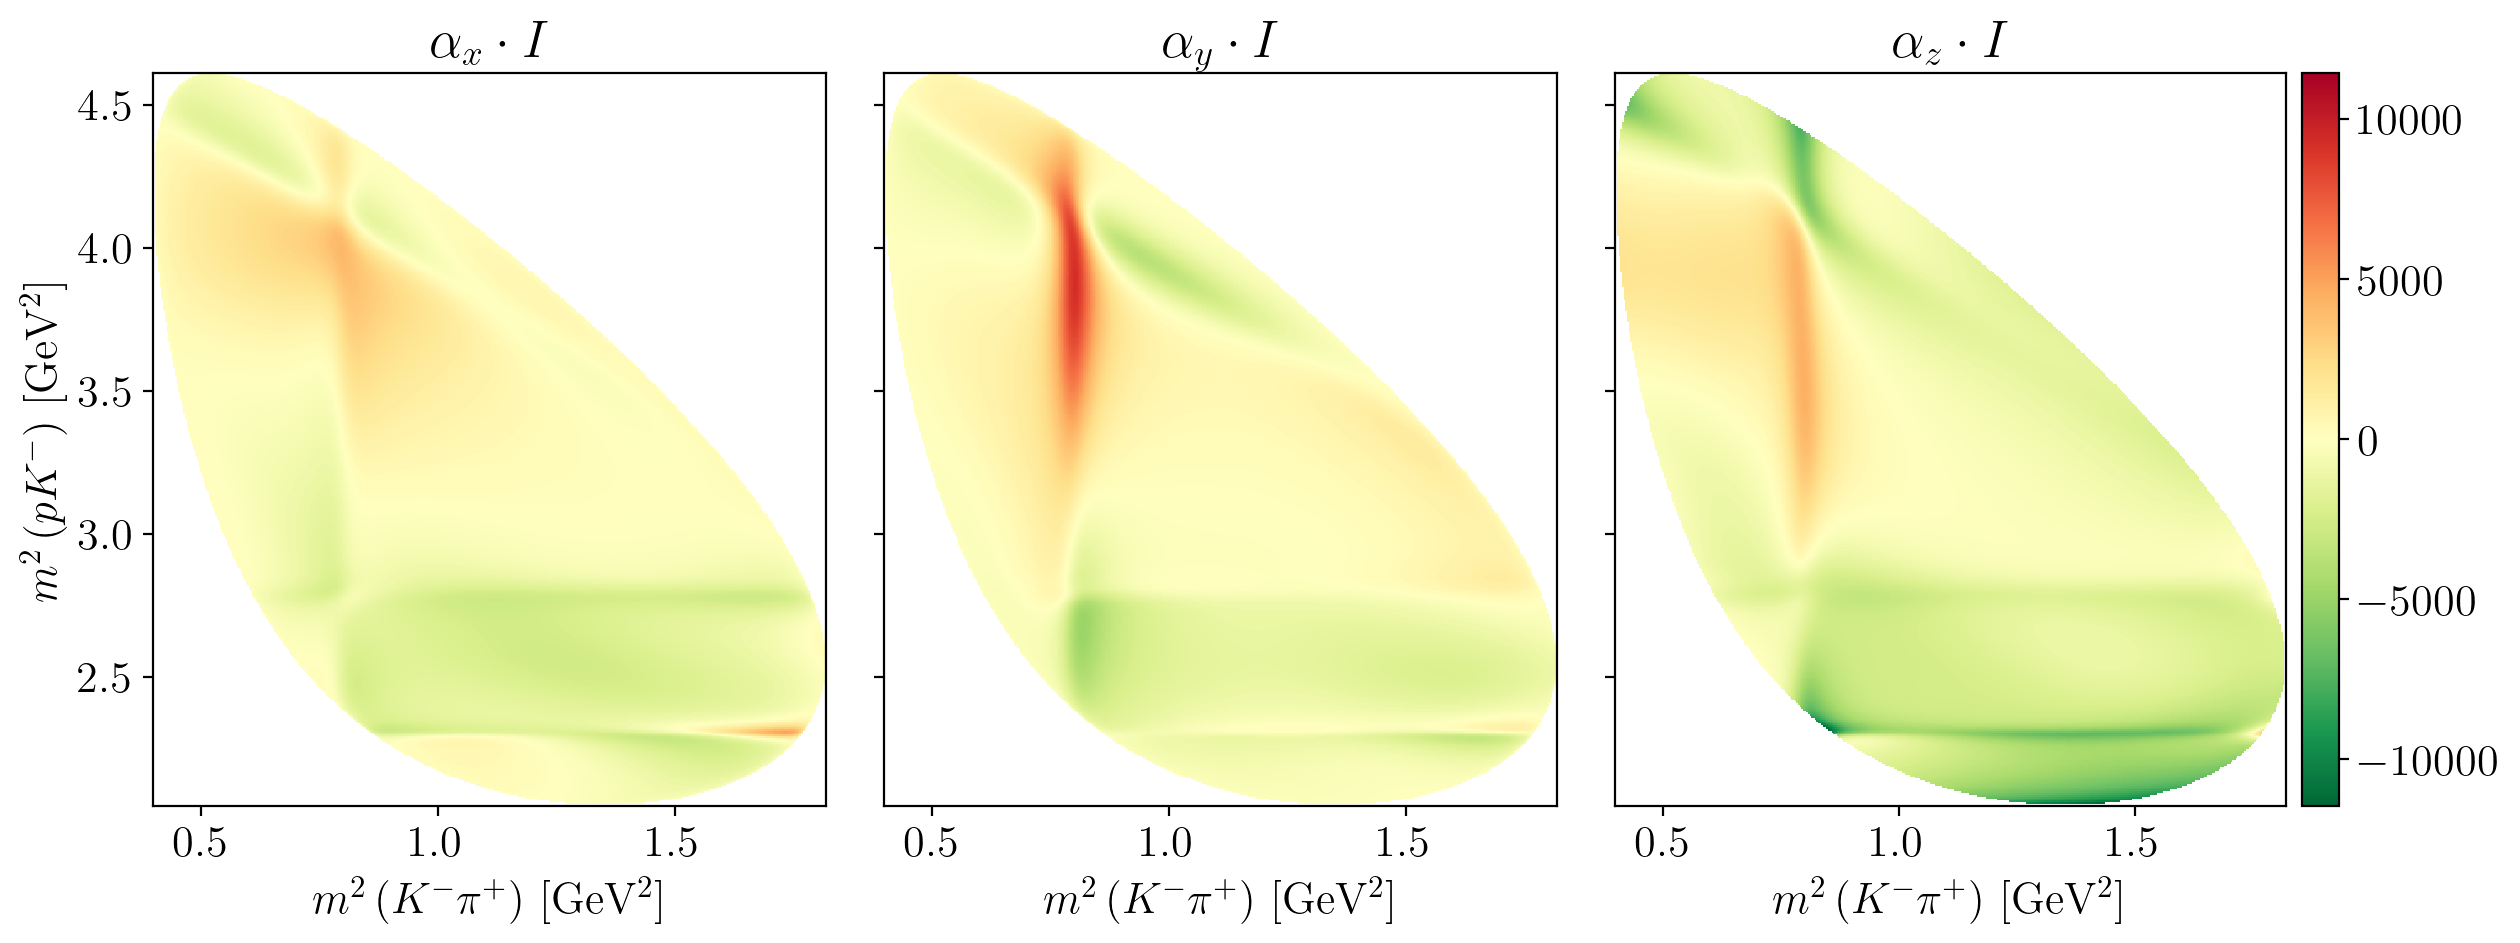
Show code cell source
%config InlineBackend.figure_formats = ['png']
plt.rcdefaults()
use_mpl_latex_fonts()
plt.rc("font", size=16)
fig, axes = plt.subplots(
    dpi=200,
    figsize=(13, 5),
    gridspec_kw={"width_ratios": [1, 1, 1.2]},
    ncols=3,
    sharey=True,
    tight_layout=True,
)
axes[0].set_ylabel(s2_label)
I_times_alpha = jnp.array(
    [array * intensity_arrays[0] for array in polarimetry_arrays]
)
global_min_max = float(jnp.nanmax(jnp.abs(I_times_alpha)))
for ax, z_values, xyz in zip(axes, I_times_alpha, "xyz"):
    ax.set_title(Rf"$\alpha_{xyz} \cdot I$")
    ax.set_xlabel(s1_label)
    mesh = ax.pcolormesh(X, Y, np.real(z_values), cmap=cm.RdYlGn_r)
    mesh.set_clim(vmin=-global_min_max, vmax=global_min_max)
    if ax is axes[-1]:
        fig.colorbar(mesh, ax=ax, pad=0.02)
plt.show()
4.2. Total polarimetry vector field#
Show code cell source
def plot_field(
    reference_subsystem: int,
    contour_arrays: dict[str, jnp.array] | None = None,
    threshold: float | None = None,
    add_title: bool = False,
    watermark: bool = False,
    show: bool = False,
) -> None:
    plt.ioff()
    plt.rcdefaults()
    use_mpl_latex_fonts()
    plt.rc("font", size=18)
    fig, ax = plt.subplots(
        figsize=(8, 6.8),
        tight_layout=True,
    )
    if add_title:
        ax.set_title(f"Reference subsystem {reference_subsystem}", y=1.02)
    ax.set_box_aspect(1)
    ax.set_xlabel(X_LABEL_ALPHA)
    ax.set_ylabel(Y_LABEL_ALPHA)

    polarimetry_arrays = [
        func(data_sample) for func in polarimetry_funcs[reference_subsystem]
    ]
    polarimetry_arrays = jnp.array(polarimetry_arrays).real
    mesh = plot_polarimetry_field(polarimetry_arrays, ax, strides=14)
    color_bar = fig.colorbar(mesh, ax=ax, pad=0.01)
    color_bar.set_label(R"$\left|\vec{\alpha}\right|$")
    if contour_arrays is not None:
        color_bar.ax.set_zorder(-10)
        xlim = ax.get_xlim()
        ylim = ax.get_ylim()
        _add_contours(ax, contour_arrays, threshold)
        ax.set_xlim(*xlim)
        ax.set_ylim(*ylim)

    if watermark:
        x_pos = 0.05 if contour_arrays is None else 0.2
        add_watermark(ax, x_pos, 0.04, fontsize=18)

    subsystem_id_to_name = {1: "K", 2: "L", 3: "D"}
    subsystem_name = subsystem_id_to_name[reference_subsystem]
    suffixes = [
        "-contours" if contour_arrays else "",
        "-title" if add_title else "",
        "-watermark" if watermark else "",
    ]
    suffix = "".join(suffixes)
    base_file = f"_static/images/polarimetry-field-{subsystem_name}{suffix}.svg"
    fig.savefig(base_file)
    plt.close(fig)
    plt.ion()

    overlay_file = f"_images/orientation-{subsystem_name}.svg"
    output_file = base_file.replace(".svg", "-inset.svg")
    y_pos = 0.08 if add_title else 0.058
    svg = overlay_inset(
        base_file,
        overlay_file,
        output_file,
        position=(0.353, y_pos),
    )
    if show:
        display(svg)


def _add_contours(
    ax,
    contour_arrays: dict[str, jnp.array],
    threshold: float,
) -> None:
    colors = dict(K="red", L="blue", D="green")
    labels = dict(K="K^{**}", L=R"\Lambda^{**}", D=R"\Delta^{**}")
    patch_transparency = 0.1
    for subsystem, Z in contour_arrays.items():
        contour_set = ax.contour(X, Y, Z, colors="none", zorder=-5)
        stylize_contour(
            contour_set,
            label=f"${labels[subsystem]}$",
            linewidth=0,
        )
        contour_line = contour_set.collections[0]
        contour_line.set_alpha(patch_transparency)
        contour_line.set_facecolor(colors[subsystem])
    legend_elements = [
        Patch(
            alpha=patch_transparency,
            facecolor=color,
            label=f"${labels[subsystem]}$",
        )
        for subsystem, color in colors.items()
    ]
    ax.legend(
        bbox_to_anchor=(0.20, 0.25),
        framealpha=1,
        handles=legend_elements,
        loc="upper right",
        prop={"size": 19},
        title=Rf"$>{100*threshold:.0f}\%$",
    )


def plot_polarimetry_field(polarimetry_arrays, ax, strides=12, cmap=cm.viridis_r):
    alpha_abs = jnp.sqrt(jnp.sum(polarimetry_arrays**2, axis=0))
    mesh = ax.quiver(
        X[::strides, ::strides],
        Y[::strides, ::strides],
        np.real(polarimetry_arrays[2][::strides, ::strides]),
        np.real(polarimetry_arrays[0][::strides, ::strides]),
        np.real(alpha_abs[::strides, ::strides]),
        cmap=cmap,
    )
    mesh.set_clim(vmin=0, vmax=+1)
    return mesh


def overlay_inset(
    base_file: str,
    overlay_file: str,
    output_file: str | None = None,
    position: tuple[float, float] = (0.355, 0.08),
    scale: float = 1 / 240,
    show: bool = False,
) -> SVG:
    if output_file is None:
        output_file = base_file
    if "_static/images/" not in base_file:
        base_file = f"_static/images/{base_file}"
    if "_images/" not in overlay_file:
        overlay_file = f"_images/{overlay_file}"
    if "_static/images/" not in output_file:
        output_file = f"_static/images/{output_file}"
    base_figure = sc.SVG(base_file)
    overlay_figure = sc.SVG(overlay_file)
    factor = 1.1
    w = factor * base_figure._width.value
    h = factor * base_figure._height.value
    new_x = position[0] * w
    new_y = position[1] * h
    figure = sc.Figure(
        w,
        h,
        sc.Panel(base_figure),
        sc.Panel(overlay_figure).scale(scale * w).move(new_x, new_y),
    ).scale(1.4)
    figure.save(output_file)
    plt.close(fig)
    svg = SVG(output_file)
    if show:
        display(svg)
    return svg


%config InlineBackend.figure_formats = ['svg']
X_LABEL_ALPHA = s1_label + R",$\quad \alpha_z$"
Y_LABEL_ALPHA = s2_label + R",$\quad \alpha_x$"
threshold = 0.7
contour_arrays = create_dominant_region_contours(DECAY, data_sample, threshold)
for ref in tqdm([1, 2, 3], leave=False):
    args = (ref, contour_arrays, threshold)
    plot_field(*args, add_title=True, watermark=False, show=True)
    plot_field(*args, add_title=True, watermark=True)
    plot_field(*args, add_title=False, watermark=False)
    plot_field(*args, add_title=False, watermark=True)
    plot_field(ref, add_title=True, watermark=False)
    plot_field(ref, add_title=True, watermark=True)
    plot_field(ref, add_title=False, watermark=False)
    plot_field(ref, add_title=False, watermark=True)
    del args, ref


4.3. Aligned vector fields per chain#
Show code cell source
def to_regex(text: str) -> str:
    regex = text
    regex = regex.replace("(", R"\(")
    return regex.replace(")", R"\)")


def plot_field_per_resonance(reference_subsystem: int, watermark: bool) -> None:
    spectator = FINAL_STATE[reference_subsystem]
    subsystem_name = subsystem_identifiers[reference_subsystem - 1]
    subsystem_resonances = [
        chain.resonance
        for chain in DECAY.chains
        if chain.resonance.name.startswith(subsystem_name)
    ]
    ncols = 3
    nrows = math.ceil(len(subsystem_resonances) / ncols)
    fig, axes = plt.subplots(
        figsize={1: (13, 5), 2: (13, 9.0)}[nrows],
        gridspec_kw={"width_ratios": [1, 1, 1.06]},
        ncols=3,
        nrows=nrows,
        sharex=True,
        sharey=True,
        tight_layout=True,
    )
    fig.suptitle(
        f"Polarimetry field, aligned to ${spectator}$",
        y={1: 0.95, 2: 0.97}[nrows],
    )
    for i, (ax, resonance) in enumerate(zip(axes.flatten(), subsystem_resonances)):
        ax.set_box_aspect(1)
        non_zero_couplings = [to_regex(resonance.name)]
        polarimetry_field = [
            compute_sub_function(func, data_sample, non_zero_couplings)
            for func in polarimetry_funcs[reference_subsystem]
        ]
        polarimetry_field = jnp.array(polarimetry_field).real
        abs_alpha = jnp.sqrt(jnp.sum(polarimetry_field**2, axis=0))
        mesh = plot_polarimetry_field(
            polarimetry_field,
            ax=ax,
            strides=22,
        )
        mean = jnp.nanmean(abs_alpha)
        std = jnp.nanstd(abs_alpha)

        text = Rf"$\overline{{\left|\vec\alpha\right|}} = {mean:.3f}$"
        if round(std, 3) != 0:
            text = text.replace("=", R"\approx")
        ax.text(
            x=1.80,
            y=4.44,
            s=text,
            fontsize=16,
            horizontalalignment="right",
        )
        ax.set_title(f"${resonance.latex}$")
        if i // 3 == nrows - 1:
            ax.set_xlabel(X_LABEL_ALPHA)
        if i % 3 == 0:
            ax.set_ylabel(Y_LABEL_ALPHA)
        if i % 3 == 2:
            color_bar = fig.colorbar(mesh, ax=ax, fraction=0.0472, pad=0.01)
            color_bar.set_label(R"$\left|\vec{\alpha}\right|$")
        if watermark:
            add_watermark(ax, fontsize=14)
    output_file = f"polarimetry-{subsystem_name}-chains"
    if watermark:
        output_file += "-watermark"
    fig.savefig(f"_static/images/{output_file}.svg", bbox_inches="tight")
    if watermark:
        plt.show()
    plt.close(fig)
    plt.ion()


%config InlineBackend.figure_formats = ['svg']
for reference_subsystem in tqdm([1, 2, 3], disable=NO_TQDM):
    plot_field_per_resonance(reference_subsystem, watermark=False)
    plot_field_per_resonance(reference_subsystem, watermark=True)
    del reference_subsystem


Show code cell source
%config InlineBackend.figure_formats = ['svg']
fig, axes = plt.subplots(
    figsize=(13, 4.5),
    gridspec_kw={"width_ratios": [1, 1, 1.14]},
    ncols=3,
    sharey=True,
    tight_layout=True,
)
fig.suptitle("Polarimetry field per sub-system", y=0.95)
items = zip(axes, [1, 2, 3], subsystem_identifiers, subsystem_labels)
for ax, reference_subsystem, subsystem_name, subsystem_label in items:
    ax.set_box_aspect(1)
    non_zero_couplings = [subsystem_name]
    polarimetry_field = [
        compute_sub_function(func, data_sample, non_zero_couplings)
        for func in polarimetry_funcs[reference_subsystem]
    ]
    polarimetry_field = jnp.array(polarimetry_field).real
    abs_alpha = jnp.sqrt(jnp.sum(polarimetry_field**2, axis=0))
    mesh = plot_polarimetry_field(
        polarimetry_field,
        ax=ax,
        strides=18,
    )
    mean = jnp.nanmean(abs_alpha)
    std = jnp.nanstd(abs_alpha)

    ax.text(
        x=1.8,
        y=4.4,
        s=Rf"$\overline{{\left|\vec\alpha\right|}} = {mean:.3f} \pm {std:.3f}$",
        fontsize=12,
        horizontalalignment="right",
    )
    spectator = FINAL_STATE[reference_subsystem]
    ax.set_title(f"${subsystem_label}$ (aligned to ${spectator}$)")
    if ax is axes[-1]:
        color_bar = fig.colorbar(mesh, ax=ax, pad=0.01)
        color_bar.set_label(R"$\left|\vec{\alpha}\right|$")

fig.savefig("_static/images/polarimetry-per-subsystem.svg")
plt.show()

Export figures for the paper
def plot_figure2(watermark: bool) -> None:
    reference_subsystem = 1
    fig, ax = plt.subplots(
        figsize=(8, 6.8),
        tight_layout=True,
    )
    ax.set_box_aspect(1)
    ax.set_xlabel(X_LABEL_ALPHA)
    ax.set_ylabel(Y_LABEL_ALPHA)
    resonance = next(
        c.resonance for c in DECAY.chains if c.resonance.name == "K(892)"
    )
    non_zero_couplings = [to_regex(resonance.name)]
    polarimetry_field = [
        compute_sub_function(func, data_sample, non_zero_couplings)
        for func in polarimetry_funcs[reference_subsystem]
    ]
    polarimetry_field = jnp.array(polarimetry_field).real
    mesh = plot_polarimetry_field(polarimetry_field, ax=ax, strides=14)
    color_bar = fig.colorbar(mesh, ax=ax, pad=0.01)
    color_bar.set_label(R"$\left|\vec{\alpha}\right|$")

    output_filename = "polarimetry-field-K892"
    if watermark:
        output_filename += "-watermark"
        add_watermark(ax, fontsize=24)
    output_filename += "-no-inset.svg"
    fig.savefig(f"_static/images/{output_filename}", transparent=True)
    overlay_inset(
        output_filename,
        "orientation-K.svg",
        output_filename.replace("-no-inset", ""),
        position=(0.34, 0.05),
        scale=4.4e-3,
        show=watermark,
    )
    plt.close(fig)


def plot_figure3(watermark: bool, reference_subsystem: int) -> None:
    fig, ax = plt.subplots(figsize=(6, 5), tight_layout=True)
    ax.set_box_aspect(1)
    ax.set_xlabel(X_LABEL_ALPHA)
    ax.set_ylabel(Y_LABEL_ALPHA)
    resonances = [c.resonance for c in DECAY.chains if c.resonance.name == "L(1520)"]
    resonance = resonances[0]
    non_zero_couplings = [to_regex(resonance.name)]
    polarimetry_field = [
        compute_sub_function(func, data_sample, non_zero_couplings)
        for func in polarimetry_funcs[reference_subsystem]
    ]
    polarimetry_field = jnp.array(polarimetry_field).real
    mesh = plot_polarimetry_field(polarimetry_field, ax=ax, strides=22)
    color_bar = fig.colorbar(mesh, ax=ax, pad=0.01)
    color_bar.set_label(R"$\left|\vec{\alpha}\right|$")

    output_filename = "polarimetry-field-L1520"
    if reference_subsystem == 2:
        output_filename += "-aligned"
    else:
        output_filename += "-unaligned"
    if watermark:
        output_filename += "-watermark"
        add_watermark(ax, 0.033, 0.04, fontsize=18)
    output_filename += "-no-inset.svg"
    fig.savefig(f"_static/images/{output_filename}", transparent=True)
    subsystem_id = {1: "K", 2: "L", 3: "D"}[reference_subsystem]
    overlay_inset(
        output_filename,
        f"orientation-{subsystem_id}.svg",
        output_filename.replace("-no-inset", ""),
        position=(0.34, 0.065),
        scale=4.1e-3,
        show=watermark,
    )
    plt.close(fig)


%config InlineBackend.figure_formats = ['svg']
plt.ioff()
for use_watermark in [False, True]:
    plot_figure2(use_watermark)
    plot_figure3(use_watermark, reference_subsystem=1)
    plot_figure3(use_watermark, reference_subsystem=2)
    del use_watermark
_ = plt.ion()