7.10. Interactive visualization#
Import python libraries
from __future__ import annotations

import logging
import os
from functools import lru_cache
from textwrap import dedent
from warnings import filterwarnings

import jax.numpy as jnp
import matplotlib.pyplot as plt
import numpy as np
import sympy as sp
from IPython.display import Markdown, display
from ipywidgets import (
    HTML,
    Button,
    FloatSlider,
    GridBox,
    HBox,
    HTMLMath,
    Layout,
    RadioButtons,
    Tab,
    interactive_output,
)
from matplotlib.colors import LogNorm
from tensorwaves.interface import DataSample, ParametrizedFunction
from tqdm.auto import tqdm
from traitlets.utils.bunch import Bunch

from polarimetry import formulate_polarimetry
from polarimetry.amplitude import simplify_latex_rendering
from polarimetry.data import (
    compute_dalitz_boundaries,
    create_data_transformer,
    generate_meshgrid_sample,
)
from polarimetry.io import (
    mute_jax_warnings,
    perform_cached_doit,
    perform_cached_lambdify,
)
from polarimetry.lhcb import load_model_builder, load_model_parameters
from polarimetry.lhcb.particle import load_particles
from polarimetry.plot import use_mpl_latex_fonts

filterwarnings("ignore")
logging.getLogger("polarimetry.function").setLevel(logging.INFO)
mute_jax_warnings()
simplify_latex_rendering()

NO_TQDM = "EXECUTE_NB" in os.environ
if NO_TQDM:
    logging.getLogger().setLevel(logging.ERROR)
Formulate amplitude models
model_choice = 0
model_file = "../../data/model-definitions.yaml"
PARTICLES = load_particles("../../data/particle-definitions.yaml")
BUILDER = load_model_builder(model_file, PARTICLES, model_id=0)
imported_parameters = load_model_parameters(
    model_file,
    BUILDER.decay,
    model_id=0,
    particle_definitions=PARTICLES,
)
MODELS = {}
for ref in (1, 2, 3):
    MODELS[ref] = BUILDER.formulate(ref)
    MODELS[ref].parameter_defaults.update(imported_parameters)
DECAY = MODELS[1].decay
RESONANCES = sorted(
    {c.resonance for c in DECAY.chains},
    key=lambda p: (p.name[0], p.mass),
)
del model_choice, model_file, imported_parameters
Definition of free parameters
def to_polar_coordinates(coupling: sp.Indexed) -> tuple[sp.Symbol, sp.Symbol]:
    superscript = sp.latex(coupling.indices[0])
    subscript = ", ".join(map(sp.latex, coupling.indices[1:]))
    suffix = f"^{{{superscript}}}_{{{subscript}}}"
    norm = sp.Symbol("C" + suffix)
    phi = sp.Symbol(R"\phi" + suffix)
    return norm, phi


PARAMETERS = {}
POLAR_SUBSTITUTIONS = {}
for model in MODELS.values():
    PARAMETERS.update(model.parameter_defaults)
    for symbol, value in model.parameter_defaults.items():
        if not symbol.name.startswith(R"\mathcal{H}"):
            continue
        if "production" not in symbol.name:
            continue
        del PARAMETERS[symbol]
        norm, phi = to_polar_coordinates(symbol)
        PARAMETERS[norm] = np.abs(value)
        PARAMETERS[phi] = np.angle(value)
        POLAR_SUBSTITUTIONS[symbol] = norm * sp.exp(phi * sp.I)
    del model

FREE_PARAMETERS = {
    s: value
    for s, value in PARAMETERS.items()
    if s.name.startswith("C")
    or s.name.startswith(R"\phi")
    or (s.name.startswith(R"\Gamma_") and "Sigma" not in s.name)
    or (s.name.startswith("m_") and "(" in s.name)
}
FIXED_PARAMETERS = {s: v for s, v in PARAMETERS.items() if s not in FREE_PARAMETERS}


@lru_cache(maxsize=None)
def unfold_and_substitute(expr: sp.Expr, reference_subsystem: int = 1) -> sp.Expr:
    expr = perform_cached_doit(expr)
    expr = perform_cached_doit(expr.xreplace(MODELS[reference_subsystem].amplitudes))
    expr = expr.xreplace(POLAR_SUBSTITUTIONS)
    return expr.xreplace(FIXED_PARAMETERS)
Formulate expressions and lambdify
def create_function(
    expr: sp.Expr, reference_subsystem: int = 1
) -> ParametrizedFunction:
    global progress_bar  # noqa: PLW0602
    expr = unfold_and_substitute(expr, reference_subsystem)
    func = perform_cached_lambdify(expr, parameters=FREE_PARAMETERS)
    progress_bar.update()
    return func


progress_bar = tqdm(total=12, disable=NO_TQDM)
INTENSITY_FUNC = {
    reference_subsystem: create_function(MODELS[reference_subsystem].intensity)
    for reference_subsystem, model in MODELS.items()
}
POLARIMETRY_FUNCS = {
    reference_subsystem: tuple(
        create_function(expr, reference_subsystem)
        for expr in formulate_polarimetry(BUILDER, reference_subsystem)
    )
    for reference_subsystem in MODELS
}
progress_bar.close()
del progress_bar
Define phase space sample for plotting
def create_grid(resolution: int) -> DataSample:
    sample = generate_meshgrid_sample(DECAY, resolution)
    for model in MODELS.values():
        transformer = create_data_transformer(model)
        sample.update(transformer(sample))
    return sample


MESH_GRID = generate_meshgrid_sample(DECAY, resolution=200)
QUIVER_GRID = generate_meshgrid_sample(DECAY, resolution=35)
for model in tqdm(MODELS.values(), disable=NO_TQDM, leave=False):
    transformer = create_data_transformer(model)
    MESH_GRID.update(transformer(MESH_GRID))
    QUIVER_GRID.update(transformer(QUIVER_GRID))

# pre-compile
for ref in tqdm(MODELS, disable=NO_TQDM, leave=False):
    INTENSITY_FUNC[ref](MESH_GRID)
    for func in POLARIMETRY_FUNCS[ref]:
        func(QUIVER_GRID)
Define sliders for the widget
def create_ui() -> HBox:
    @temporarily_deactivate_continuous_update
    def reset_sliders(click_event: Button | None = None) -> None:
        for symbol, value in FREE_PARAMETERS.items():
            set_slider(SLIDERS[symbol.name], value)

    reset_button = Button(description="Reset sliders", button_style="danger")
    reset_button.on_click(reset_sliders)
    reset_sliders()

    @temporarily_deactivate_continuous_update
    def set_reference_subsystem(value: Bunch) -> None:
        global REFERENCE_SUBSYSTEM  # noqa: PLW0603
        subsystems = {1: "K", 2: "L", 3: "D"}
        REFERENCE_SUBSYSTEM = value.new
        for name, slider in SLIDERS.items():
            if not name.startswith(R"\phi"):
                continue
            if subsystems[value.old] in name or subsystems[value.new] in name:
                phi = slider.value
                set_slider(slider, -np.sign(phi) * (np.pi - abs(phi)))

    reference_selector = RadioButtons(
        description="Reference sub-system",
        options=[
            ("1: K** → π⁺K⁻", 1),
            ("2: Λ** → pK⁻", 2),
            ("3: Δ** → pπ⁺", 3),
        ],
        layout=Layout(width="auto"),
    )
    reference_selector.observe(set_reference_subsystem, names="value")

    @temporarily_deactivate_continuous_update
    def set_coupling_to_zero(filter_pattern: Button) -> None:
        if isinstance(filter_pattern, Button):
            filter_pattern = from_unicode(filter_pattern.description)
        for name, slider in SLIDERS.items():
            if not name.startswith("C"):
                continue
            if filter_pattern not in name:
                continue
            set_slider(slider, 0)

    def set_all_to_zero(action: Button | None = None) -> None:
        set_coupling_to_zero("D")
        set_coupling_to_zero("K")
        set_coupling_to_zero("L")

    all_to_zero = Button(
        description="Set all couplings to zero",
        layout=Layout(width="auto"),
        tooltip="Set all couplings to zero",
    )
    all_to_zero.on_click(set_all_to_zero)
    resonance_buttons = []
    for p in RESONANCES:
        button = Button(
            description=to_unicode(p.name),
            layout=Layout(width="auto"),
            tooltip=f"Set couplings for {to_unicode(p.name)} to 0",
        )
        button.style.button_color = to_html_color(p.name)
        button.on_click(set_coupling_to_zero)
        resonance_buttons.append(button)
    subsystem_buttons = []
    for subsystem_id in sorted(["D", "K", "L"]):
        button = Button(
            description=f"{to_unicode(subsystem_id)}**",
            tooltip=f"Set couplings for all {to_unicode(subsystem_id)}** to 0",
        )
        button.style.button_color = to_html_color(subsystem_id)
        button.on_click(set_coupling_to_zero)
        subsystem_buttons.append(button)
    zero_coupling_panel = GridBox(
        [
            all_to_zero,
            HBox(subsystem_buttons),
            GridBox(
                np.reshape(resonance_buttons, (4, 3)).T.flatten().tolist(),
                layout=Layout(grid_template_columns=4 * "auto "),
            ),
        ]
    )

    def get_subscript(p):
        return f"{p.name} \\to p K^-" if "1405" in p.name else p.name

    grouped_sliders = []
    for p in RESONANCES:
        row = (
            HTML("", layout=Layout(width="auto")),
            SLIDERS[f"m_{{{p.name}}}"],
            SLIDERS[Rf"\Gamma_{{{get_subscript(p)}}}"],
        )
        rows = [row]
        for slider_name in SLIDERS:
            if p.name not in slider_name:
                continue
            if not slider_name.startswith("C"):
                continue
            row = (
                HTMLMath(
                    f"${slider_name}$".replace("C", R"\mathcal{H}"),
                    layout=Layout(width="auto"),
                ),
                SLIDERS[slider_name],
                SLIDERS[slider_name.replace("C", R"\phi")],
            )
            rows.append(row)
        rows = np.array(rows)
        grouped_sliders.append(
            GridBox(
                rows.flatten().tolist(),
                layout=Layout(grid_template_columns=3 * "auto "),
            )
        )
    return HBox(
        [
            GridBox([reset_button, reference_selector]),
            Tab(grouped_sliders, titles=[to_unicode(p.name) for p in RESONANCES]),
            zero_coupling_panel,
        ]
    )


def create_slider(symbol: sp.Basic, value: float) -> FloatSlider:
    (
        (s1_min, s1_max),
        (s2_min, s2_max),
        (s3_min, s3_max),
    ) = compute_dalitz_boundaries(DECAY)
    slider = FloatSlider(
        description=Rf"\({sp.latex(symbol)})",
        continuous_update=True,
        readout_format=".3f",
        step=1e-3,
    )
    if symbol.name.startswith("m"):
        slider.description = "mass"
        slider.style.handle_color = "lightblue"
        if "K" in symbol.name:
            slider.min = np.sqrt(s1_min)
            slider.max = np.sqrt(s1_max)
        elif "L" in symbol.name:
            slider.min = np.sqrt(s2_min)
            slider.max = np.sqrt(s2_max)
        elif "D" in symbol.name:
            slider.min = np.sqrt(s3_min)
            slider.max = np.sqrt(s3_max)
    elif symbol.name.startswith(R"\Gamma"):
        slider.description = "width"
        slider.style.handle_color = "lightblue"
        slider.min = 0
        slider.max = max(0.5, 2 * slider.value)
    elif symbol.name.startswith("C"):
        slider.description = "r"
        slider.min = 0
        slider.max = 20
        slider.readout_format = ".1f"
        slider.step = 1e-1
    elif symbol.name.startswith(R"\phi"):
        slider.description = "φ"
        slider.min = -np.pi
        slider.max = +np.pi
        slider.readout_format = ".2f"
        slider.step = 1e-2
    return slider


def set_slider(slider: FloatSlider, value: float) -> None:
    n_decimals = -round(np.log10(slider.step))
    if slider.value != round(value, n_decimals):  # widget performance
        slider.value = value


def to_html_color(name: str) -> str:
    if "K" in name:
        return "#FFCCCB"  # light red
    if "L" in name:
        return "lightblue"
    if "D" in name:
        return "lightgreen"
    raise NotImplementedError


def to_unicode(text: str) -> str:
    text = text.replace("L", "Λ")
    return text.replace("D", "Δ")


def from_unicode(text: str) -> str:
    text = text.replace("Λ", "L")
    text = text.replace("Δ", "D")
    return text.replace("*", "")


def temporarily_deactivate_continuous_update(func):
    def new_func(*args, **kwargs):
        for slider in SLIDERS.values():
            slider.continuous_update = False
        output = func(*args, **kwargs)
        for slider in SLIDERS.values():
            slider.continuous_update = True
        return output

    return new_func


REFERENCE_SUBSYSTEM = 1
SLIDERS = {s.name: create_slider(s, value) for s, v in FREE_PARAMETERS.items()}
UI = create_ui()
Create interactive plot
def create_interactive_plot() -> None:
plt.rcdefaults()
use_mpl_latex_fonts()
plt.rc("font", size=20)
fig, axes = plt.subplots(
figsize=(15, 7.5),
ncols=2,
sharey=True,
)
ax1, ax2 = axes
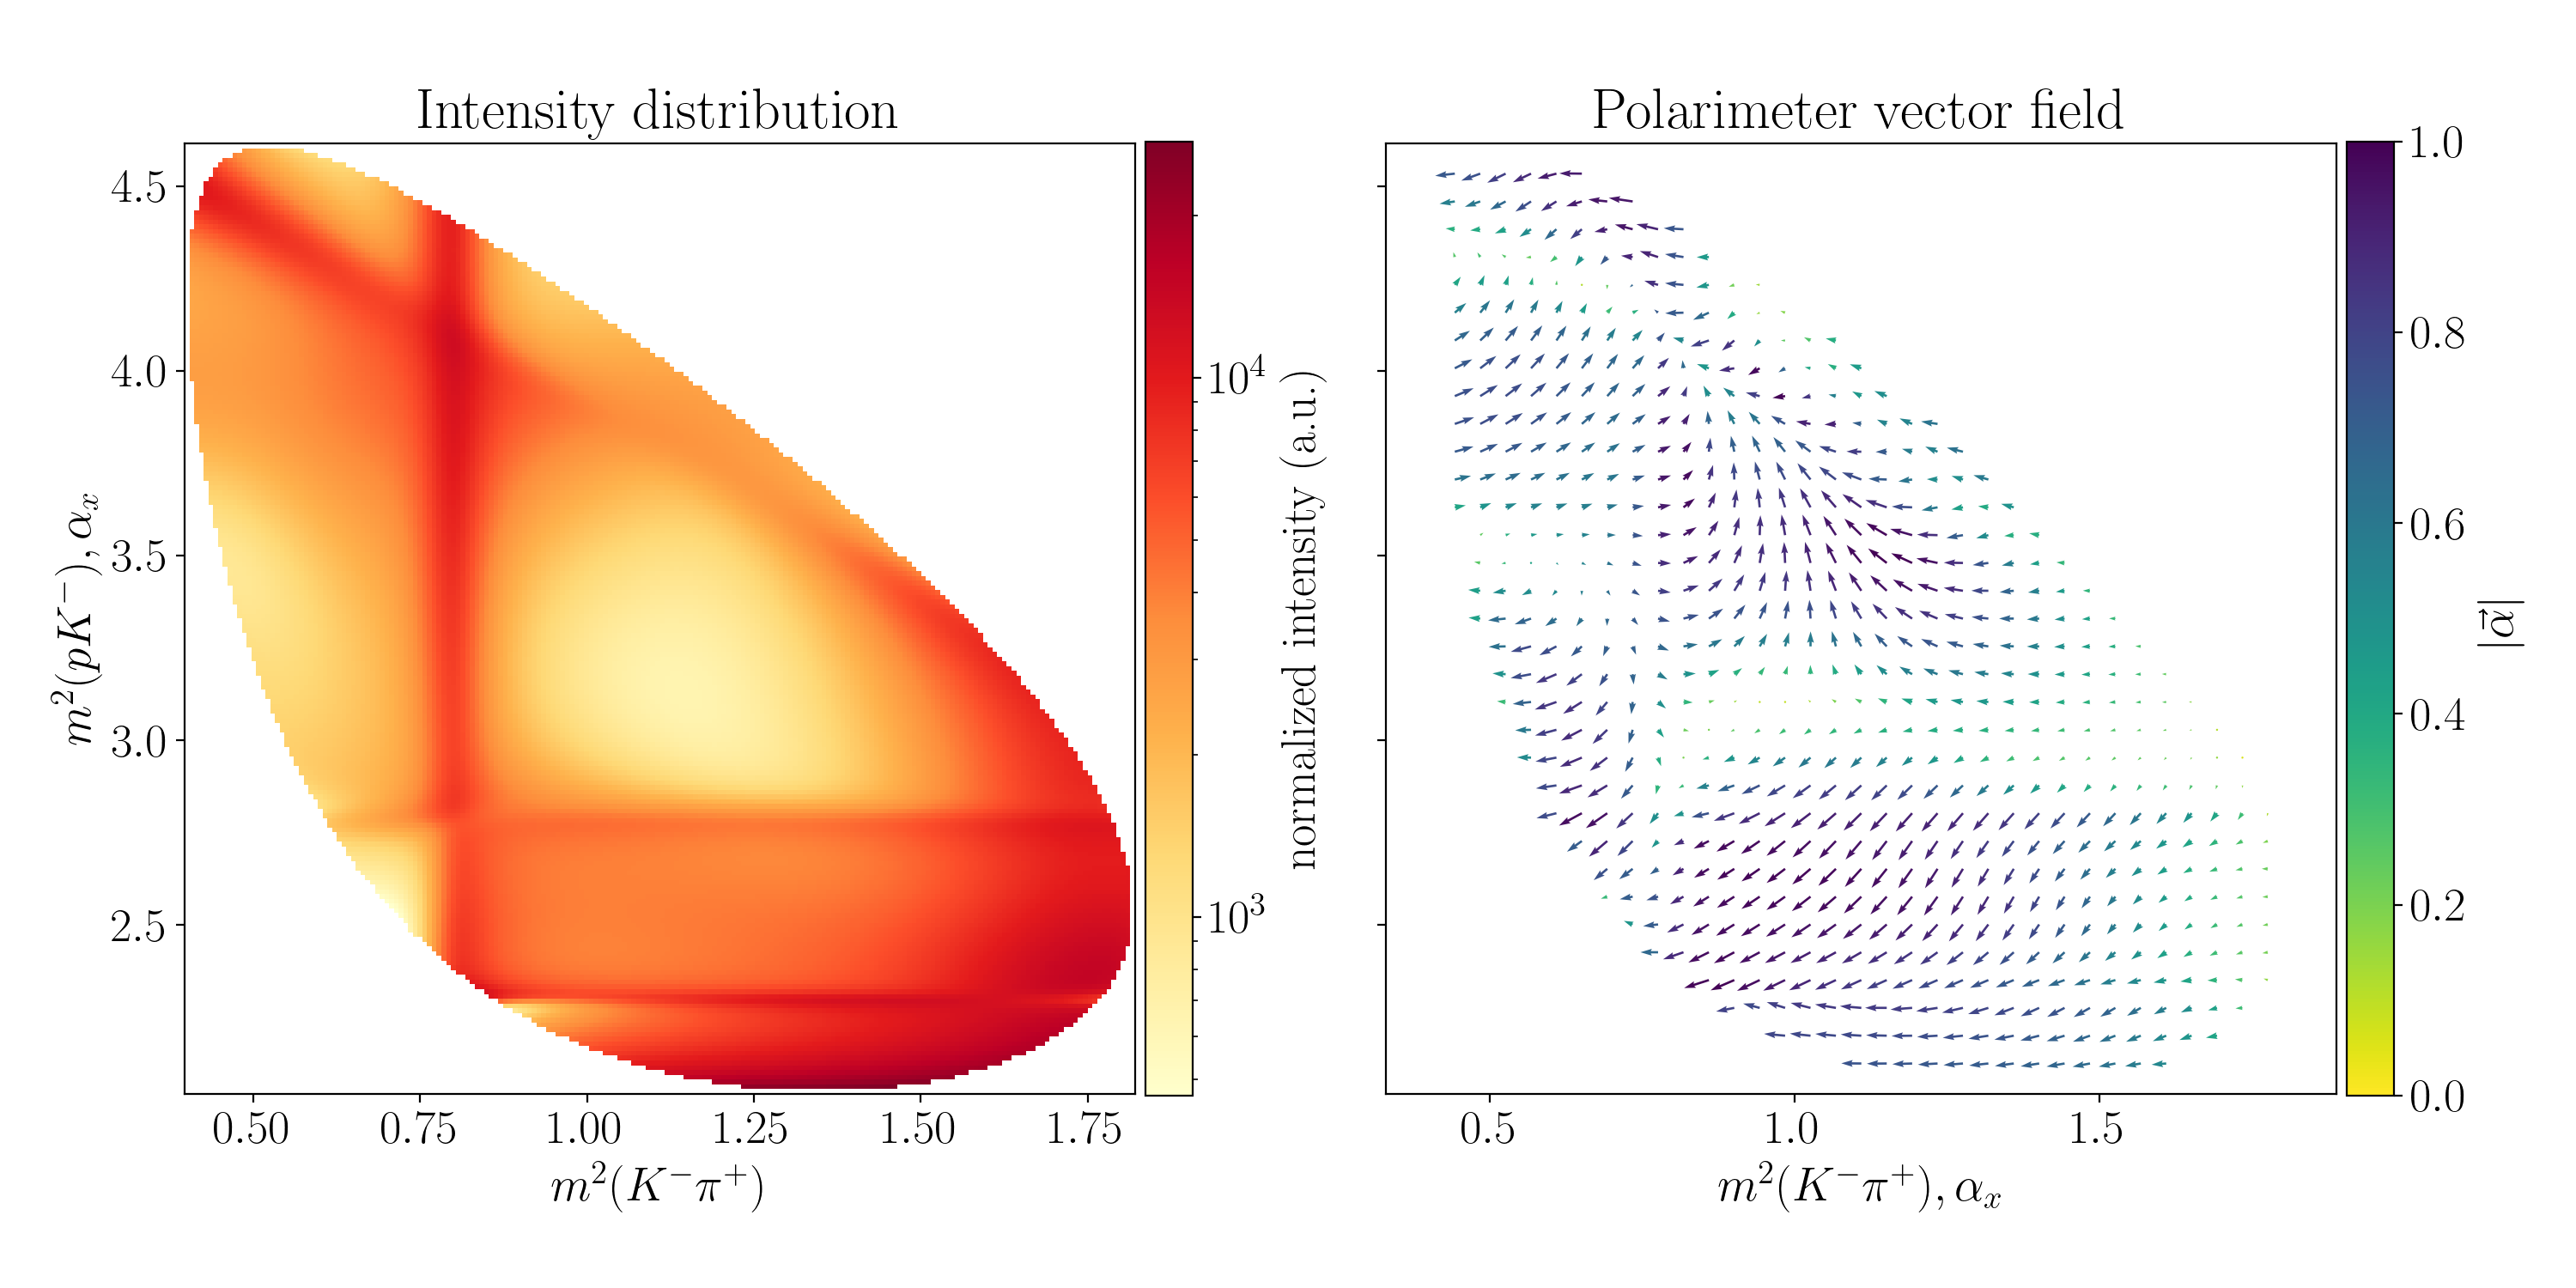
ax1.set_title("Intensity distribution")
ax2.set_title("Polarimeter vector field")
ax1.set_xlabel(R"$m^2(K^- \pi^+)$")
ax2.set_xlabel(R"$m^2(K^- \pi^+), \alpha_x$")
ax1.set_ylabel(R"$m^2(p K^-), \alpha_x$")
for ax in axes:
ax.set_box_aspect(1)
fig.canvas.toolbar_visible = False
fig.canvas.header_visible = False
fig.canvas.footer_visible = False
mesh = None
quiver = None
intensity_bar = None
def plot3(**kwargs):
nonlocal quiver, mesh, intensity_bar
intensity_func = INTENSITY_FUNC[REFERENCE_SUBSYSTEM]
polarimetry_funcs = POLARIMETRY_FUNCS[REFERENCE_SUBSYSTEM]
for func in [intensity_func, *polarimetry_funcs]:
func.update_parameters(kwargs)
intensities = intensity_func(MESH_GRID)
αx, αy, αz = tuple(func(QUIVER_GRID).real for func in polarimetry_funcs)
abs_α = jnp.sqrt(αx**2 + αy**2 + αz**2)
if mesh is None:
mesh = ax1.pcolormesh(
MESH_GRID["sigma1"],
MESH_GRID["sigma2"],
intensities,
cmap=plt.cm.YlOrRd,
norm=LogNorm(),
)
intensity_bar = fig.colorbar(mesh, ax=ax1, pad=0.01, fraction=0.0473)
intensity_bar.ax.set_ylabel("normalized intensity (a.u.)")
else:
mesh.set_array(intensities)
if jnp.isfinite(intensities).any():
y_min = max(np.nanmin(intensities), 1e0)
y_max = max(np.nanmax(intensities), 1e2)
mesh.set_clim(y_min, y_max)
intensity_bar.ax.set_ylim(y_min, y_max)
if quiver is None:
quiver = ax2.quiver(
QUIVER_GRID["sigma1"],
QUIVER_GRID["sigma2"],
αz,
αx,
abs_α,
cmap=plt.cm.viridis_r,
clim=(0, 1),
)
c_bar = fig.colorbar(quiver, ax=ax2, pad=0.01, fraction=0.0473)
c_bar.ax.set_ylabel(R"$\left|\vec\alpha\right|$")
else:
quiver.set_UVC(αz, αx, abs_α)
fig.canvas.draw_idle()
output = interactive_output(plot3, controls=SLIDERS)
fig.tight_layout()
if NO_TQDM:
export_file = "../_static/images/interactive-plot.png"
fig.savefig(export_file, dpi=200)
src = f"""
:::{{container}} full-width

:::
"""
src = dedent(src)
display(Markdown(src))
else:
display(output, UI)
%matplotlib widget
create_interactive_plot()
Tip
Run this notebook locally in Jupyter or online on Binder to modify parameters interactively!